viz#
Visualization functions for matplotlib: plot ranges, streamgraphs, log-fitting, polar grids, complex number plotting, and more.
Example output#

API reference#
random functions that are helpful
- matviz.viz.axis_robust(AX)[source]#
Set axis limits selectively, leaving
Noneentries unchanged.- Parameters:
- AXlist of 4 floats or None
[xmin, xmax, ymin, ymax]. UseNonefor any limit you want to keep at its current value.
Examples
>>> axis_robust([0, None, None, None]) # only set xmin to 0
- matviz.viz.bar_centered(y, **kwargs)[source]#
Bar plot centered on integers 1 through N.
- Parameters:
- yarray-like
Bar heights.
- **kwargs
Passed to
plt.bar.
- Returns:
- containerBarContainer
The bar container.
- matviz.viz.brighten(c, frac=0.5)[source]#
Brighten an RGB color by blending it toward white.
- Parameters:
- carray-like
RGB color (values 0-1).
- fracfloat, optional
Blend fraction. Smaller values produce brighter colors. Default is 0.5.
- Returns:
- colorndarray
Brightened RGB color.
- matviz.viz.calc_plot_ROC(y1, y2)[source]#
Plot an ROC curve from two distributions used as a binary classifier.
- Parameters:
- y1array-like
Scores for the negative class.
- y2array-like
Scores for the positive class.
- Returns:
- aucfloat
Area under the ROC curve.
- matviz.viz.cplot(z, *args, **kargs)[source]#
Plot complex numbers on the real/imaginary plane.
- Parameters:
- zcomplex array-like
Complex data to plot (real -> x, imag -> y).
- *args, **kargs
Passed to
plt.plot.
- matviz.viz.cscatter(z, *args, **kargs)[source]#
Scatter plot of complex numbers on the real/imaginary plane.
- Parameters:
- zcomplex array-like
Complex data (real -> x, imag -> y).
- *args, **kargs
Passed to
plt.scatter.
- matviz.viz.ctext(z, *args, **kargs)[source]#
Place text at a position given by a complex number.
- Parameters:
- zcomplex
Position (real -> x, imag -> y).
- *args, **kargs
Passed to
plt.text.
- matviz.viz.errorb(cur_series, serror=True)[source]#
Bar plot with error bars from a pandas Series of arrays.
- Parameters:
- cur_seriespandas.Series
Each element is an array-like of values. The index provides x-tick labels.
- serrorbool, optional
If True (default), use standard error. If False, use standard deviation.
- matviz.viz.fancy_plotter(x, y, marker_style='o', line_styles=None)[source]#
Plot x vs y with a linear trend line overlay.
- Parameters:
- xarray-like
X data.
- yarray-like
Y data.
- marker_stylestr, optional
Marker format string. Default is
'o'.- line_stylesdict, optional
Keyword arguments for the trend line. Default is
{'color': '0.4', 'lw': 3}.
- matviz.viz.format_axis_date(rot=77)[source]#
Rotate x-axis tick labels for date readability.
- Parameters:
- rotfloat, optional
Rotation angle in degrees. Default is 77.
- matviz.viz.interp_plot(x, y, *args, **kargs)[source]#
Plot with PCHIP interpolation for smooth curves from sparse data.
- Parameters:
- xarray-like
X data (supports pandas Timestamps).
- yarray-like
Y data. NaN values are removed before interpolation.
- *args, **kargs
Passed to
plt.plot.
- Returns:
- x_indarray
Interpolated x values.
- y_indarray
Interpolated y values.
- matviz.viz.jitter(xx, yy, maxn=4, xscale=None)[source]#
Horizontally jitter overlapping points so they are visible.
- Parameters:
- xxarray-like
X positions.
- yyarray-like
Y positions (used to detect overlap).
- maxnint, optional
Maximum number of dots wide per bin. Default is 4.
- xscalefloat, optional
Horizontal spacing between jittered points. Default is auto.
- Returns:
- xxndarray
Jittered x positions.
- matviz.viz.large_fig(fig_num=1)[source]#
Create a large figure (15 x 8 inches).
- Parameters:
- fig_numint, optional
Figure number. Default is 1.
- matviz.viz.legend_helper(fig: Figure | Axes, *args: Iterable[Axes]) Dict[str, Any][source]#
Collect legend handles and labels from multiple axes.
- Parameters:
- figFigure or Axes
A matplotlib Figure (collects from all its axes) or a single Axes.
- *argsAxes
Additional axes to collect from (when fig is an Axes).
- Returns:
- dict
Dict with
'handles'and'labels'lists.
- matviz.viz.linspecer(n, color='muted')[source]#
Generate n distinguishable colors from a seaborn palette.
- Parameters:
- nint
Number of colors.
- colorstr, optional
Seaborn palette name. Default is
'muted'.
- Returns:
- colorsndarray of shape (n, 3)
RGB color values.
- matviz.viz.logfit(x, y=None, graph_type='linear', ftir=0.05, marker_style='.k', line_style='--g', skip_begin=0, skip_end=0)[source]#
Fit and plot a line through data on linear, semi-log, or log-log axes.
- Parameters:
- xarray-like
X data (or y data if y is None, or complex with real=x, imag=y).
- yarray-like, optional
Y data.
- graph_type{‘linear’, ‘logy’, ‘loglog’}, optional
Fit type. Default is
'linear'.- ftirfloat, optional
Fraction to extend the fit line beyond the data. Default is 0.05.
- marker_stylestr or dict, optional
Marker style for data points. Default is
'.k'.- line_stylestr or dict, optional
Line style for the fit. Default is
'--g'.- skip_begin, skip_endint, optional
Number of points to skip at the beginning/end of the fit.
- Returns:
- slopefloat
Slope of the fit.
- interceptfloat
Intercept of the fit.
- matviz.viz.nicefy(fsize=15, f_size=False, clean_legend=False, cur_fig=None, background='white', resize=False, legend_outside=False, expand_y=False, expand_x=False, touch_limits=False, touch_text=False)[source]#
Make the current figure publication-ready.
Adjusts font sizes, removes top/right spines, applies tight layout, and optionally sets background color and cleans up legends.
- Parameters:
- fsizeint, optional
Font size for all text elements. Default is 15.
- f_sizeint, optional
Deprecated alias for fsize.
- clean_legendbool, optional
If True, make the legend background transparent. Default is False.
- cur_figFigure, optional
Figure to nicefy. Default is the current figure.
- backgroundstr, optional
'white','black', or a matplotlib style name. Default is'white'.- touch_limitsbool, optional
If True, enable tight autoscaling. Default is False.
- expand_y, expand_xbool or str, optional
Expand axis limits slightly.
Trueexpands both directions,'top'expands only the upper end. Default is False.- touch_textbool, optional
If True, auto-format axis label and title text. Default is False.
- matviz.viz.plot_ROC(y_true, y_score, c='k')[source]#
Plot an ROC curve from true labels and predicted scores.
- Parameters:
- y_truearray-like
Binary ground-truth labels.
- y_scorearray-like
Predicted scores (higher = more likely positive).
- cstr, optional
Line color. Default is
'k'.
- Returns:
- aucfloat
Area under the ROC curve.
- matviz.viz.plot_axes(color='.5')[source]#
Plot both horizontal and vertical reference lines at zero.
- Parameters:
- colorstr, optional
Line color. Default is
'.5'.
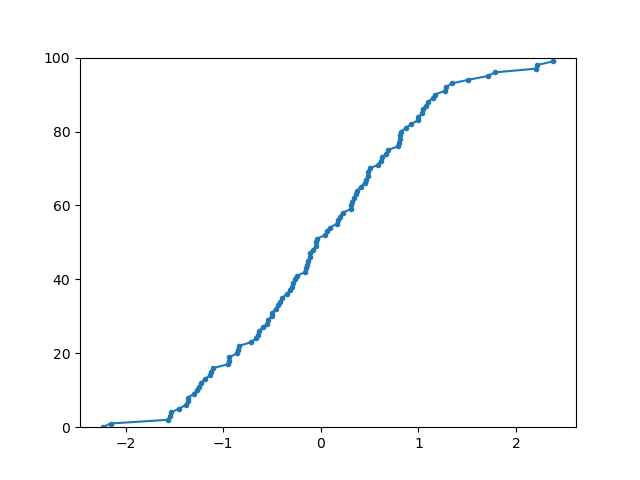
- matviz.viz.plot_cdf(data, *args, **kargs)[source]#
Plot the empirical cumulative distribution function (CDF).
- Parameters:
- dataarray-like
Input data. NaN values are removed.
- *args, **kargs
Passed to
plt.plot.
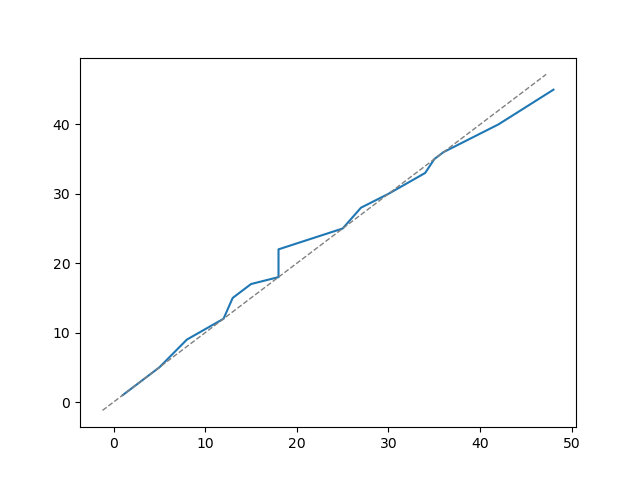
- matviz.viz.plot_diag(lw=1, color='.5', reverse=False)[source]#
Plot a diagonal x=y reference line on the current axes.
- Parameters:
- lwfloat, optional
Line width. Default is 1.
- colorstr, optional
Line color. Default is
'.5'.- reversebool, optional
If True, plot x = -y instead. Default is False.
- matviz.viz.plot_pin(x, y, color='k')[source]#
Plot a pin (vertical line with dot) at a specific x position.
- Parameters:
- xfloat
X position of the pin.
- yfloat
Height of the pin.
- colorstr, optional
Color of the line and marker. Default is
'k'.
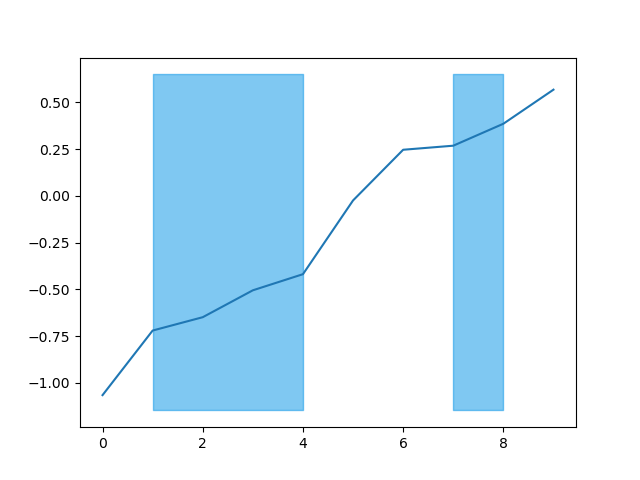
- matviz.viz.plot_range(events, color='#0093e7', y_offset='none', height='none', zorder=None, alpha=0.5, **varargs)[source]#
Shade vertical regions on the current axes.
- Parameters:
- eventslist of [start, end] pairs
X positions defining the regions to shade.
- colorstr, optional
Fill color. Default is
'#0093e7'.- y_offsetfloat, optional
Bottom of the shaded region. Default uses current y-axis lower limit.
- heightfloat, optional
Height of the shaded region. Default spans the full y-axis.
- zorderint, optional
Drawing order.
- alphafloat, optional
Transparency. Default is 0.5.
- matviz.viz.plot_range_idx(t, events, **varargs)[source]#
Shade regions by index into a time series.
Converts index pairs into time-domain ranges and calls plot_range.
- Parameters:
- tarray-like
Time series (x-axis values).
- eventslist of [start_idx, end_idx] pairs
Index pairs into t defining the regions.
- **varargs
Passed to plot_range.
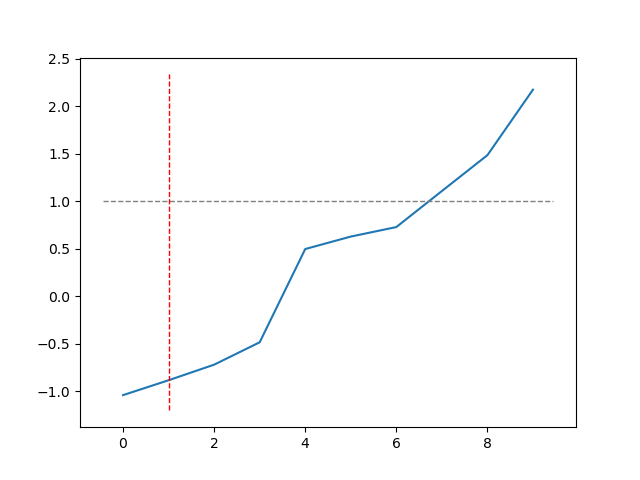
- matviz.viz.plot_zero(lineheight=0, axx='x', **kwargs)[source]#
Plot a horizontal or vertical reference line.
- Parameters:
- lineheightfloat, optional
Position of the line. Default is 0.
- axx{‘x’, ‘y’}, optional
'x'for a horizontal line,'y'for vertical. Default is'x'.- **kwargs
Passed to
plt.plot. Defaults to a gray dashed line.
- matviz.viz.polar_grid(lw=1, r=False, linecolor='.3', style=':', nrings=2, nrays=6)[source]#
Overlay a polar grid (rings and rays) on the current axes.
Useful for complex-plane plots.
- Parameters:
- lwfloat, optional
Line width. Default is 1.
- rfloat, optional
Radius of the grid. Default is auto-detected from axis limits.
- linecolorstr, optional
Color of grid lines. Default is
'.3'.- stylestr, optional
Line style. Default is
':'.- nringsint, optional
Number of concentric rings. Default is 2.
- nraysint, optional
Number of radial rays. Default is 6.
- Returns:
- linelist of Line2D
The plotted grid lines.
- matviz.viz.pop_all()[source]#
Bring all matplotlib figures to the foreground.
Useful when using IPython in the terminal.
- Returns:
- int
Number of figures shown.
- matviz.viz.set_fontsize(f_size=15)[source]#
Set the font size of the current axes’ title, labels, and tick labels.
- Parameters:
- f_sizeint, optional
Font size in points. Default is 15.
- Returns:
- axmatplotlib.axes.Axes
The current axes.
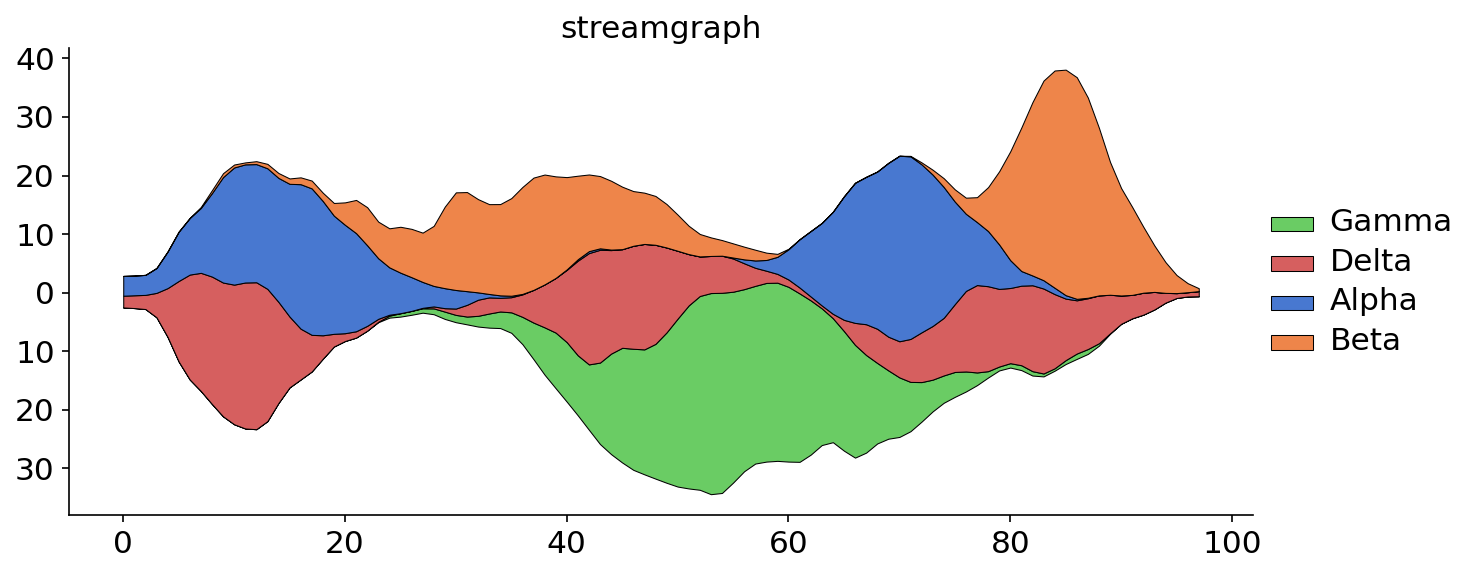
- matviz.viz.streamgraph(df, smooth=None, normalize=None, wiggle=None, label_dict=None, color=None, order=True, linewidth=0.5, round_time=False, legend_flag=True)[source]#
Create a streamgraph (stacked area chart with wiggle baseline).
- Parameters:
- dfDataFrame
Two-column DataFrame: first column is the time/x axis, second column is the categorical variable to stack.
- smoothint, optional
Smoothing window width. Default is None (no smoothing).
- normalizebool, optional
If True, normalize to 100%. Default is None.
- wigglebool or str, optional
Baseline mode. True for wiggle, False for zero baseline, or
'stream'/'river'for weighted wiggle. Default is auto.- colorstr, dict, or palette, optional
Seaborn palette name, dict of label->color, or palette object.
- orderbool or list, optional
True to sort by peak height, or a list of labels. Default is True.
- linewidthfloat, optional
Edge line width. Default is 0.5.
- round_timestr, optional
Pandas frequency string to round the time column. Default is False.
- legend_flagbool, optional
Show legend. Default is True.
- Returns:
- axmatplotlib.axes.Axes
The axes with the streamgraph.
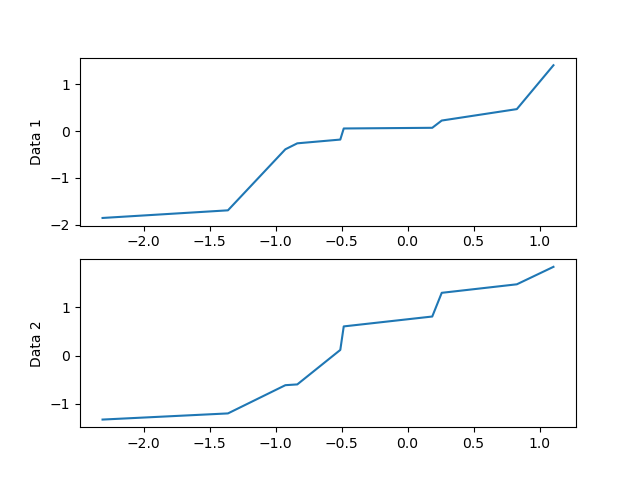
- matviz.viz.subplotter(x, y=None, nth=None, xlbl=None, ylbl=None, y_ticks=None)[source]#
MATLAB-style subplot with 0-based indexing and spanning support.
- Parameters:
- xint
Number of rows, or a 3-digit integer like
220meaning 2 rows, 2 columns, 0th subplot.- yint, optional
Number of columns.
- nthint or list of int, optional
Subplot index (0-based). Pass a list to span multiple cells.
- xlblstr, optional
X-axis label, shown only on the bottom row.
- ylblstr, optional
Y-axis label, shown only on the left column.
- y_tickslist or False, optional
Y-tick labels for non-left columns. False hides them.
- Returns:
- axmatplotlib.axes.Axes
The created subplot axes.
- matviz.viz.subplotter_auto(n, ii, **kwargs)[source]#
Create a subplot with automatically chosen grid dimensions.
Computes a near-square grid that fits n subplots and activates the ii-th one.
- Parameters:
- nint
Total number of subplots.
- iiint
Index of the subplot to activate (0-based).
- **kwargs
Passed to subplotter.
- matviz.viz.suplabel(axis, label, label_prop=None, labelpad=5, ha='center', va='center')[source]#
Add a shared xlabel or ylabel to the figure, similar to
suptitle.- Parameters:
- axis{‘x’, ‘y’}
Which axis to label.
- labelstr
The label text.
- label_propdict, optional
Keyword arguments for
plt.text.- labelpadfloat, optional
Padding from the axis in points. Default is 5.
- hastr, optional
Horizontal alignment. Default is
'center'.- vastr, optional
Vertical alignment. Default is
'center'.