histogram_utils#
Smart 1D and 2D histograms with automatic binning using Scott’s normal reference rule.
Example output#
nhist#
ndhist#

API reference#
- matviz.histogram_utils.choose_bins(X, min_bins=10, max_bins=175, bin_factor=1.5, sameBinsFlag=False, std_times=4, minx=None, maxx=None, int_bins_flag=None, exclude_extremes=True)[source]#
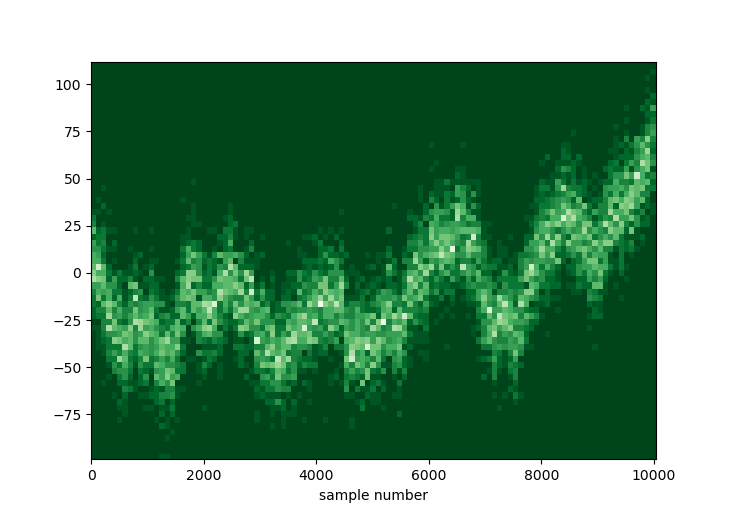
- matviz.histogram_utils.ndhist(x, y=None, log_colorbar_flag=False, maxx=None, maxy=None, minx=None, miny=None, int_bins_flag=False, int_bins_flagx=False, int_bins_flagy=False, exclude_extremes=False, normy=False, normx=False, fx=1.5, fy=1.5, std_times=4, f=None, smooth=False, markertype=None, normr=False, colors='none', levels=False, level_color=None)[source]#
Plot a 2D histogram (heat map) with automatic binning.
Accepts two arrays, a single array (treated as a time series), or a complex-valued array (real/imag mapped to x/y).
- Parameters:
- xarray-like or complex array
X values, or y values if y is not given, or complex numbers where real part is x and imaginary part is y.
- yarray-like, optional
Y values. Leave blank for time-series mode or complex input.
- log_colorbar_flagbool, optional
Use a log scale for the color bar. Default is False.
- maxx, maxy, minx, minyfloat, optional
Axis limits. Default is None (auto).
- int_bins_flagbool, optional
Force both x and y bin edges onto integers. Default is False.
- int_bins_flagx, int_bins_flagybool, optional
Force only x or y bins onto integers. Default is False.
- exclude_extremesbool, optional
Exclude edge bins that collect data beyond std_times. Default is False.
- normybool, optional
Normalize colors per y-slice. Default is False.
- normxbool, optional
Normalize colors per x-slice. Default is False.
- fxfloat, optional
Bin factor for x-axis. Default is 1.5.
- fyfloat, optional
Bin factor for y-axis. Default is 1.5.
- std_timesfloat, optional
Number of standard deviations to display. Default is 4.
- ffloat, optional
Bin factor applied to both axes. Overrides fx and fy.
- smoothfloat, optional
Gaussian filter sigma in pixels. 0 or False for no smoothing. Default is False.
- markertypestr, optional
Marker style to overlay data points (e.g.
'.').- levelsbool or list, optional
If True, draw filled contours. If a list of values, draw contour lines at those percentile levels. Default is False.
- level_colordict, optional
Dict with
'level'and'cmap'keys for filled contour coloring.
- Returns:
- figmatplotlib.figure.Figure
The current figure. Data is attached as
fig.ndhist, a dict with keys'counts','bins_x', and'bins_y'.
Examples
>>> x = np.random.randn(10000)
>>> y = x + np.random.randn(10000)
>>> fig = ndhist(x, y)
>>> z = (5 + np.random.randn(1000)) * np.exp(1j * np.random.randn(1000))
>>> fig = ndhist(z, smooth=1)
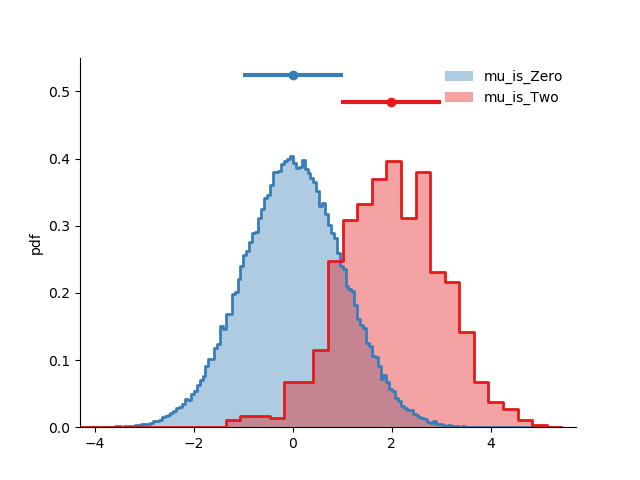
- matviz.histogram_utils.nhist(X, f=1.2, title=None, xlabel=None, ylabel=None, labels=None, legend=None, noerror=False, max_bins=175, std_times=4, color=None, normalize=False, same_bins_flag=False, int_bins_flag=None, maxx=None, minx=None, exclude_extremes=False, alpha=0.4)[source]#
Plot one or more histograms with automatic binning.
Automatically sets the number and range of bins using Scott’s normal reference rule. Compares multiple datasets on one plot with legend, mean, and standard deviation markers.
- Parameters:
- Xlist, dict, or DataFrame
The data to histogram. Can be a single list/array, a list of lists, a dictionary of arrays, or a pandas DataFrame.
- ffloat, optional
Factor applied to Scott’s normal reference rule. Higher values produce more bins. Default is 1.2.
- titlestr, optional
Title for the plot.
- xlabelstr, optional
Label for the x-axis.
- ylabelstr, optional
Label for the y-axis. Default is inferred from other settings.
- labelslist of str, optional
Legend labels for each dataset.
- legendlist of str, optional
Alias for labels.
- noerrorbool, optional
If True, suppress the mean/std error bars. Default is False.
- max_binsint, optional
Maximum number of bins allowed. Default is 175.
- std_timesfloat, optional
Number of standard deviations to show on each side. Data beyond this is bunched into edge bars. Default is 4.
- colorlist or str, optional
List of RGB colors, a seaborn palette, or a palette name string.
- normalizebool or str, optional
Controls the y-axis.
Falseuses counts for single plots and PDF for multiple. Options:'frac','proportion','percent','number','none', orTruefor PDF.- same_bins_flagbool, optional
Force all datasets to use identical bin edges. Default is False.
- int_bins_flagbool, optional
Force bin edges onto integers. Default is None (auto-detect).
- maxxfloat, optional
Maximum x-axis limit.
- minxfloat, optional
Minimum x-axis limit.
- exclude_extremesbool, optional
If True, exclude the edge bars that collect data beyond std_times. Default is False.
- alphafloat, optional
Transparency of the histogram bars. Default is 0.4.
- Returns:
- figmatplotlib.figure.Figure
The current figure. Histogram data is attached as
fig.nhist, a dict with keys'N'(counts),'bins'(bin edges), and'rawN'(raw counts before normalization).
Examples
>>> A = {'mu=0': np.random.randn(10**5), 'mu=2': np.random.randn(10**3) + 2}
>>> fig = nhist(A)
>>> fig = nhist(A, color='viridis')
>>> fig = nhist(A, same_bins_flag=True)